
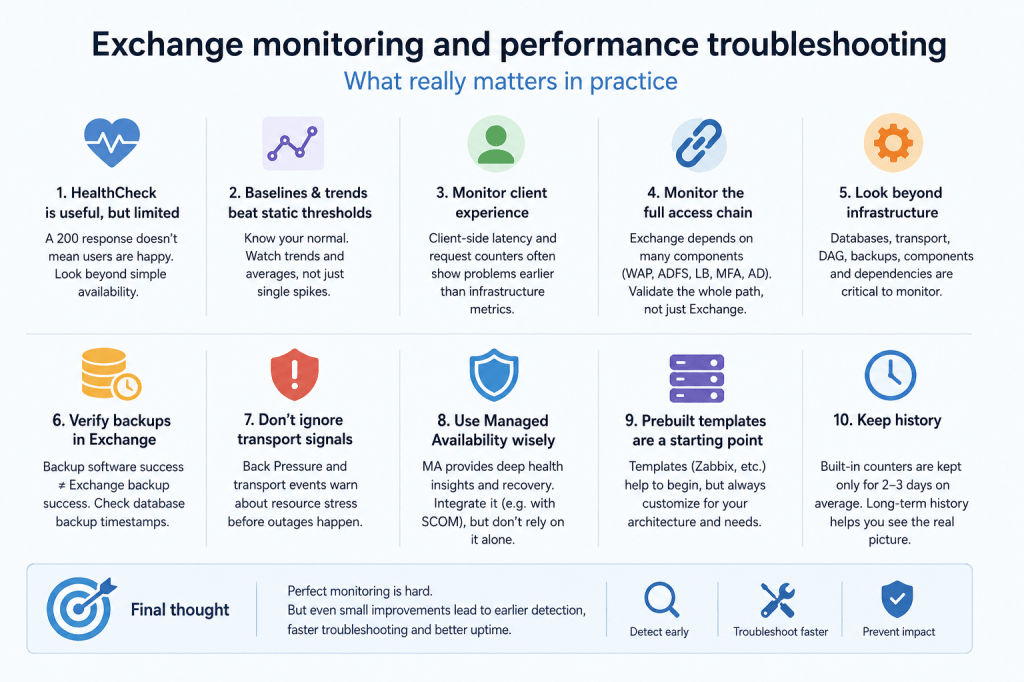
Exchange performance troubleshooting is an enormous topic.
Entire books can be written about Exchange monitoring, performance analysis, baselines, dependency troubleshooting, storage validation, client experience analysis, transport diagnostics, and observability design. And I can recommend one called “Exchange Server Troubleshooting Companion” by Paul Cunningham and Andrew Higginbotham which should be available for free now.
Because of this, the goal of this article is not to describe an “ideal monitoring system” or provide a complete list of counters and thresholds.
Instead, I would like to highlight some of the most important practical observations I repeatedly encounter during Exchange infrastructure assessments and real-world troubleshooting cases.
📉 The reality of Exchange monitoring in many organizations
Unfortunately, in many environments, Exchange monitoring remains relatively basic.
In the most common implementations, monitoring usually includes:
- CPU utilization;
- memory usage;
- free disk space;
- Windows services state;
- basic availability checks.
More advanced organizations may additionally implement:
- synthetic mail flow testing;
- external delivery monitoring;
- response time validation;
- load balancer health checks.
However, these implementations are still more the exception than the rule.
In many cases, monitoring is focused primarily on:
“Is the server alive?”
rather than:
“Is the environment gradually degrading?”
And this distinction matters significantly for Exchange.
🩺 HealthCheck endpoints are useful — but limited
Exchange HealthCheck endpoints are commonly used by load balancers to verify server availability.
Examples include:
/owa/healthcheck.htm
These endpoints can also be integrated into enterprise monitoring systems together with response time measurements.
This is useful because:
- it validates IIS responsiveness;
- it confirms application-level availability;
- it allows detection of obvious outages;
- it provides simple latency measurements.
However, it is important to understand their limitations.
A successful HealthCheck response does not necessarily mean:
- Outlook users are unaffected;
- authentication latency is healthy;
- backend proxying is healthy;
- Active Directory dependencies are healthy;
- user experience is normal.
In practice, environments may continue returning healthy HTTP responses while users already experience:
- Outlook freezes;
- authentication prompts;
- delayed mailbox access;
- intermittent connectivity;
- transport delays.
🌐 Monitoring should include the full access chain
Another important practical observation is that monitoring only Exchange itself is often insufficient.
In many environments, user access depends on multiple additional infrastructure layers such as:
- load balancers;
- Web Application Proxy (WAP);
- ADFS;
- reverse proxies;
- MFA providers;
- external authentication systems.
One particularly interesting real-world example involved monitoring Outlook Web App published through WAP and ADFS using claims-based authentication.
Monitoring should ideally validate the entire authentication and access workflow rather than only TCP connectivity or basic HTTP responses.
📊 Monitoring is not the same as troubleshooting
This is one of the most important distinctions.
Monitoring primarily helps detect anomalies and early warning signs.
Troubleshooting attempts to determine, what is actually causing the degradation.
During performance investigations, we often correlate multiple signals simultaneously:
- performance counters;
- IIS logs;
- HTTPERR logs;
- Schannel events;
- transport queues;
- Active Directory latency;
- storage metrics;
- network traces;
- client-side symptoms.
and etc.
This type of correlation is usually performed manually during analysis.
In practice, fully automating this type of root-cause correlation inside monitoring systems is extremely difficult.
Because of this, monitoring systems usually rely on:
- thresholds;
- trends;
- averages;
- anomaly detection over time;
- baseline deviations.
And this is completely normal.
📈 Baselines matter more than static thresholds
One common mistake is treating Microsoft-recommended thresholds as absolute values.
In reality, Exchange environments differ significantly.
Some counters may have official recommendations, while others require organization-specific baselines.
For example:
Memory\% Committed Bytes In Use
Microsoft commonly recommends values below approximately 80%.
However, if a particular environment normally operates around 45–50%, then sustained growth to 65–70% may already indicate abnormal behavior long before the official threshold is reached.
I recently investigated a case where memory usage gradually reached the committed memory limit and remained there for an extended period before the customer noticed visible service degradation. The primary consumer was PowerShell-related activity.
The important lesson here is: severe Exchange degradation is often preceded by weaker early signals.
And monitoring should ideally detect those signals before users experience a major outage.
⏱️ Single spikes are not always a problem
Exchange is a highly dynamic workload.
Temporary spikes may occur during:
- backup operations;
- maintenance;
- mailbox moves;
- transport bursts;
- client reconnect storms;
- antivirus activity;
- Active Directory delays.
Because of this, a single threshold breach does not necessarily indicate a user-visible problem.
In many situations, analyzing:
- sustained values;
- moving averages;
- historical trends;
- recurring patterns;
is far more useful than reacting to isolated peaks.
This is especially important for:
- disk latency;
- authentication latency;
- transport queues;
- LDAP request counters;
- MAPI/HTTP latency.
📨 Client experience counters are extremely valuable
One important observation during Exchange troubleshooting is that infrastructure-level counters alone may not reflect actual user experience.
For example:
- disk latency may exceed recommendations;
- CPU may spike;
- transport queues may grow;
while users still do not notice obvious problems.
At the same time, client-related counters often expose degradation much earlier.
Examples include:
MSExchange MapiHttp Emsmdb\Average Latency
This counter shows average backend request latency in milliseconds calculated over the last 1024 packets.
In many healthy environments, values are often below approximately ~15 ms
However:
- Microsoft does not currently publish strict official thresholds for this counter;
- acceptable values depend heavily on workload and architecture;
- organizations should ideally establish their own baseline.
Another useful counter:
MSExchange MapiHttp Emsmdb\Requests
This counter shows the number of client requests currently being processed by the MAPI/HTTP endpoint.
In many environments, sustained values above approximately ~20 may already indicate request accumulation or backend processing delays.
Similarly, the following counters are often useful during investigations:
MSExchange HttpProxy(*)\Averaged Authentication Latency
and:
MSExchange HttpProxy(*)\Averaged Client Access Server Processing Latency
These counters help evaluate performance for Mapi\Http clients (Outlook):
- authentication delays;
- proxy processing delays;
- frontend/backend communication latency.
For many of these counters, Microsoft does not provide strict official thresholds.
Because of this, establishing and understanding your own baseline is often more important than searching for universal numbers.
🧰 Prebuilt monitoring templates are only a starting point
Some monitoring systems, such as Zabbix and others, provide prebuilt Exchange monitoring templates.
These templates may be useful as an initial starting point and often include:
- basic service monitoring;
- CPU and memory usage;
- disk space validation;
- availability checks;
- basic performance counters.
However, in practice such templates are often:
- generic;
- minimally customized;
- not fully adapted for specific Exchange architectures;
- not always updated for architectural changes introduced starting with Exchange 2013 and higher.
So, effective Exchange monitoring usually requires environment-specific customization rather than relying entirely on default templates.
🗄️ Exchange monitoring should include Exchange-specific semantics
One common problem with infrastructure monitoring is that it often validates only generic system state:
- CPU;
- RAM;
- disks;
- services.
However, Exchange has many application-specific operational states that are equally important.
Examples include:
- mailbox database state;
- transport queues;
- DAG replication health;
- component states;
- cluster resources;
- backup state;
- Managed Availability alerts.
This is especially important because Exchange may appear healthy from the operating system perspective while application-level functionality is already degraded.
💾 Backup monitoring should validate Exchange state itself
This is an especially important practical example.
Many organizations monitor only:
- backup software alerts;
- backup job completion status.
However, this does not always guarantee that Exchange itself considers the backup successful.
Some time ago I encountered a situation where network equipment silently closed an inactive backup session. The backup software considered the operation completed successfully.
However:
- Exchange did not register backup completion correctly;
- database backup timestamps were not updated;
- operationally, the environment was no longer protected as expected.
This type of issue can often be detected by monitoring Exchange database backup timestamps directly.
For example:
Get-MailboxDatabase -Status | fl Name,*backup*
This is a good example of why Exchange monitoring should validate not only infrastructure activity, but also Exchange-specific operational semantics.
🚦 Exchange transport already contains built-in protection mechanisms
Exchange transport itself also includes internal monitoring and self-protection logic.
One important example is Back Pressure.
Back Pressure is a built-in Exchange transport protection mechanism designed to reduce or stop mail flow when critical resources become exhausted.
Examples include:
- insufficient disk space;
- excessive memory pressure;
- transport database pressure;
When Back Pressure activates, Exchange transport may:
- delay message processing;
- reject incoming connections;
- temporarily stop accepting new messages;
- protect the server from complete transport failure.
Because of this, monitoring transport-related events and queue behavior is extremely important during performance investigations.
Transport-related warning and Back Pressure events often provide early indicators of infrastructure stress long before a complete outage occurs.
Microsoft documentation:
Back pressure in Exchange Server
🧠 Managed Availability is important — but not a replacement for enterprise monitoring
Starting with Exchange 2013, Microsoft introduced Managed Availability.
Managed Availability continuously monitors Exchange using:
- probes;
- monitors;
- responders;
- synthetic transactions;
- event analysis;
- performance counters.
It can also attempt automatic recovery actions such as:
- recycling application pools;
- restarting services;
- placing components into maintenance states.
Managed Availability stores monitoring information in dedicated event channels such as:
Microsoft-Exchange-ManagedAvailability/Monitoring
This data can be integrated with enterprise monitoring systems. A well-known example is Microsoft SCOM, which can consume Managed Availability alerts and monitoring events directly from Exchange event channels.
This allows administrators to combine:
- Exchange internal health awareness;
- infrastructure monitoring;
- alerting;
- historical reporting;
- escalation workflows.
Managed Availability is extremely useful and provides deep Exchange-specific health awareness.
However, it should not be treated as a complete replacement for enterprise-wide monitoring and historical observability.
🧩 Dependencies matter more than many people expect
One of the most important realities of Exchange troubleshooting is the following:
Exchange performance problems are often caused by something outside Exchange itself.
Common dependencies include:
- Active Directory;
- DNS;
- storage;
- virtualization;
- antivirus;
- TLS infrastructure;
- load balancers;
- network devices.
In many situations, Exchange simply becomes the first component where users notice the symptoms.
This is why effective monitoring should include not only Exchange itself, but also the infrastructure Exchange depends on.
🔄 Cluster and DAG monitoring still matters
As discussed in our previous articles, Exchange DAG health should also be monitored continuously.
This includes:
- File Share Witness availability;
- cluster quorum state;
- replication queues;
- database copy status;
- replay queue length;
- component states.
A particularly important point is that some failures may remain invisible for long periods before a specific failover or disaster scenario exposes them.
🎯 Final thoughts
Building truly comprehensive Exchange monitoring is difficult.
A mature monitoring implementation usually requires:
- understanding Exchange architecture;
- identifying critical dependencies;
- defining organization-specific baselines;
- validating user experience;
- monitoring external authentication chains;
- correlating infrastructure and application behavior;
- collecting historical performance data.
In practice, this often becomes a separate engineering project rather than simply “adding several counters”.
At the same time, even relatively small monitoring improvements may significantly improve operational visibility.
In many environments, adding monitoring for:
- client latency;
- DAG state;
- transport queues;
- backup timestamps;
- authentication delays;
- dependency availability;
- historical utilization trends;
already helps detect problems much earlier and simplifies incident investigation significantly.
Another important practical point is historical data retention.
Exchange collects a large amount of built-in diagnostic and performance information out of the box. However, many internal counters and diagnostic datasets are retained only for a relatively short period of time – often approximately several days depending on the component and workload.
Because of this, collecting and retaining historical monitoring data externally is often extremely valuable.
Longer-term statistics may help identify:
- gradual performance degradation;
- abnormal growth trends;
- periodic spikes;
- resource exhaustion patterns;
- recurring operational anomalies.
And in many cases, historical trends become far more useful than point-in-time observations after the incident has already occurred.
Ultimately, effective Exchange monitoring is not about creating a perfect dashboard.
It is about improving visibility early enough to react before a small degradation becomes a major outage.
End.


Leave a Reply