
🧩Introduction to LogParser and Log Parser Studio
ChangeLog:
04.09.24 This blog was corrected from initial version, some queries are optimized, screenshots updated and added a section for best practices and optimization.
💡Note. If you copy and paste a query to your LogParser Studio and it doesn’t work with syntax error, first check if quotation marks are fine in the query and looks like single quotes as it looks on screenshots.
LogParser is a powerful tool used for parsing log files from Microsoft products, it’s allows to analyze a variety of log formats. Developed by Microsoft, LogParser facilitates the querying of text-based data. It supports data in log files, XML, CSV, and key data sources.
You can download LogParser from Microsoft’s official website. Installation is a simple setup process.
Log Parser Studio is great graphical user interface (GUI) to function as a front-end to Log Parser and a ‘Query Library’ in order to manage queries and scripts that one builds up over time. LPS doesn’t require an installation, you just have to extract it to the folder of your choice and run LPS.EXE. You can download latest version (at this time) from the link in the end of this blog post.
📌LogParser Studio and Exchange Server
Exchange server has a huge number of different logs and processing these logs for different Exchange protocols is a time consuming task. Even one specific log file can be several GB in size (IIS, for example). Without corresponding tools it’s almost impossible to find information you need just going though those logs manually.
Log Parser Studio (LPS) is mainly designed for quick and easy processing of different logs for Exchange protocols. Of cause, you also need expertise in writing SQL queries. But log parser studio has a lot of predefined queries for different Exchange protocols, i.e. Microsoft Exchange ActiveSync, Exchange Web Services (EWS), Outlook Web App and others. LPS required logparser to be pre-installed.
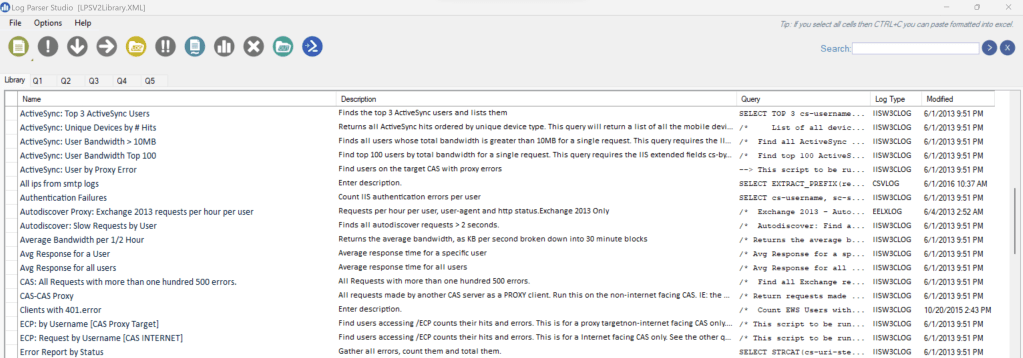
I’m not going to go through LPS in detail, there are a couple of blogs that describe that topic very well (I’ve listed them in the end of post), so I would recommend going through them first, if you’re not familiar with LPS at all. In short, LPS is GUI for logparser, you can use pre-created queries, write new ones, export data, save queries in ps1 format, build charts and so on.
Below we will concentrate on specific cases and tasks related to Exchange Server.
🛠️Troubleshooting IIS logs
📌IIS logs basics
When you have issues with client connectivity (your Outlook client cannot connect, Mobile devices have some issues, common performance issues) in some cases it’s useful to investigate IIS logs.
IIS offers flexible logging options, allowing you to choose from different log formats like W3C (World Wide Web Consortium), IIS, NCSA. By default, IIS logs are in W3C format.
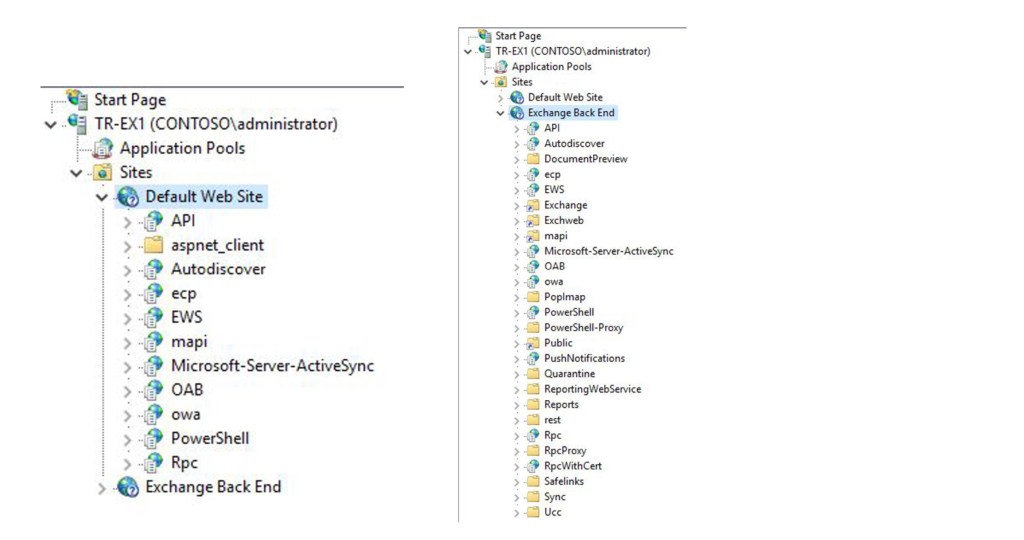
In Exchange server we have FrontEnd (Default Web Site) and Backend (Exchange Back End) sites. By default, logging is enabled for both sites. You can change different logging options using IIS manager.
Logs are not rotated by IIS, so if you want to remove old logs to save some space on your disk drive, you can use a custom script. Some customers also relocate logs to different disk drive.
Note. If you have never used IIS logs to troubleshoot Exchange connectivity issues, it’s recommended to verify that logs are enabled and successfully created. Otherwise, you can encounter an issue, when logs are absent when you really need them.
IIS requests aren’t instantaneously logged, it can take some time for IIS to flush data to a log. In case you would like to force it, you can use command below:
netsh http flush logbuffer
Date-time in W3C log file is in UTC time format (this is the same for almost all other logs). That means, if problem was seen at 3:00 pm in GMT+3, you need to look for records occurred at 12:00 pm in IIS logs.
The timestamp of the logs and when logs roll can vary, by default logs are created daily and date is listed in the name of the log. Logs can get very large [1GB per day per server or more is common].
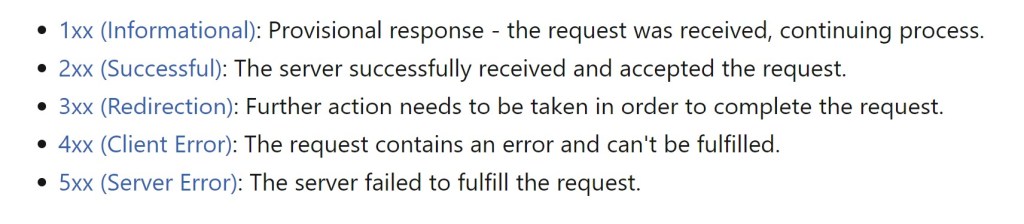
When you try to access content on a server that is running IIS by using the HTTP protocol, IIS returns a numeric code that indicates the result of the request and semantics of the response, including whether the request was successful. I would recommend to read this article, if you’re not familiar with IIS and HTTP protocol to learn more about your status codes 🔗HTTP status codes in IIS.
Administrator has the option of 🔗logging additional custom fields from request or response headers for W3C log files, or from server variables. It’s recommended to add sc-bytes [sent] and cs-bytes [received] to W3C logging fields to get better trending analysis.
Another example of custom field that often used – X-Forwarded-For header, that logs actual client IP address. Note, that you usually need to configure this feature on your load balancer, if your current configuration doesn’t preserve client IP. For example, KEMP documentation describes this process 🔗here.
📌IIS logs structure
By default, logs for Default Web Site are located in C:\inetpub\logs\LogFiles\W3SVC1 and in C:\inetpub\logs\LogFiles\W3SVC2 for Back End.
W3C format uses space as separator. Let’s look at example of 3 requests coming from one client.
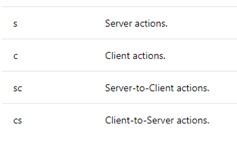
#Fields: date time s-ip cs-method cs-uri-stem ccs-uri-query s-port cs-username c-ip cs(User-Agent) cs(Referer) sc-status sc-substatus sc-win32-status time-taken
#Software: Microsoft Internet Information Services 10.0
#Version: 1.0
#Date: 2024-01-09 00:00:09
#Fields: date time s-ip cs-method cs-uri-stem cs-uri-query s-port cs-username c-ip cs(User-Agent) cs(Referer) sc-status sc-substatus sc-win32-status time-taken
2024-01-09 01:28:16 172.16.250.66 POST /mapi/nspi/ MailboxId=356c0b0e-bca0-4aa5-90ae-615f9fea1237@kite2u.com&CorrelationID=<empty>;&cafeReqId=bcd47208-b7f1-4b59-80f4-c37c514d3e36; 443 – 212.45.3.130 Microsoft+Office/16.0+(Windows+NT+10.0;+Microsoft+Outlook+16.0.17029;+Pro) – 401 1 2148074254 19
2024-01-09 01:28:16 172.16.250.66 POST /mapi/nspi/ MailboxId=356c0b0e-bca0-4aa5-90ae-615f9fea1237@kite2u.com&CorrelationID=<empty>;&cafeReqId=c1ed9246-2ff5-4977-bf05-f773c89f6285; 443 – 212.45.3.130 Microsoft+Office/16.0+(Windows+NT+10.0;+Microsoft+Outlook+16.0.17029;+Pro) – 401 1 2148074254 24
2024-01-09 01:28:16 172.16.250.66 POST /mapi/nspi/ MailboxId=356c0b0e-bca0-4aa5-90ae-615f9fea1237@kite2u.com&CorrelationID=<empty>;&ClientRequestInfo=R:{5493C8AA-C459-475C-95E9-5C55796BBA4A}:906;RT:PING;CI:{8B746ACD-A42C-4D15-844F-13E47D9F7FA9}:73120010;CID:{9BCD44ED-1737-4E07-90E8-7668F0A1FFF9}&cafeReqId=85e19cb0-924c-4446-86ec-a1fd4ae51f8c; 443 KITE2U\Administrator 212.45.3.130 Microsoft+Office/16.0+(Windows+NT+10.0;+Microsoft+Outlook+16.0.17029;+Pro) – 200 0 0 62
We are not going through HTTP protocol basics here. But the initial request from a client is typically an anonymous request, not containing any authentication information. HTTP server apps can deny anonymous requests while indicating that authentication is required. The server app sends WWW-Authentication headers to indicate the supported authentication schemes. That’s why in this example you can see 2 requests ending with 401 status (NTLM authentication is used). In case Kerberos is configured, you can see only one 401 status for request.
cs-uri-stem indicates protocol / directory being used /accessed. In this example it’s Mapi/Http, but can be Autodiscover, owa and etc. /mapi/emsmdb defines connections to mailbox, /mapi/nspi defines connections to address book. Also, this request contains Mailbox Guid, that indicates specific Mailbox. Information in ClientRequestInfo (for example, cafeReqId) can be used to correlate this requests with corresponding http proxy logs.
The User-Agent request header is a characteristic string that lets servers and network peers identify the application, operating system, vendor, and/or version of the requesting user agent. In this example Outlook 2016 (with quite old build) connects via MAPI / HTTP protocol.
cs-uri-query contains information about exact query, information is client and protocol specific.
For more info about fields see: https://docs.microsoft.com/en-us/windows/desktop/http/w3c-logging
📌IIS logs and LPS
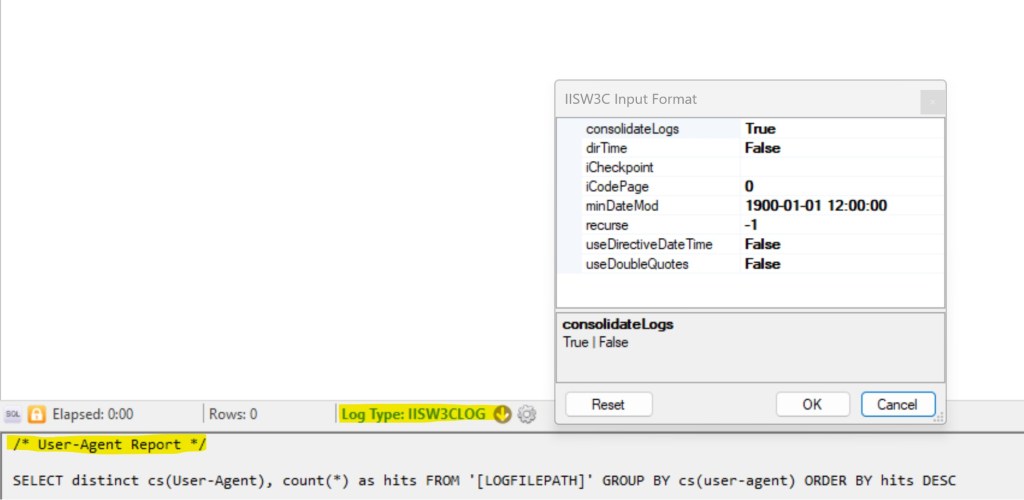
LPS has some pre-defined non-Exchange specific reports, you can use them as is, or modify according to your needs. Below you can see User-Agent report as example with pre-defined IISW3CLOG log type:
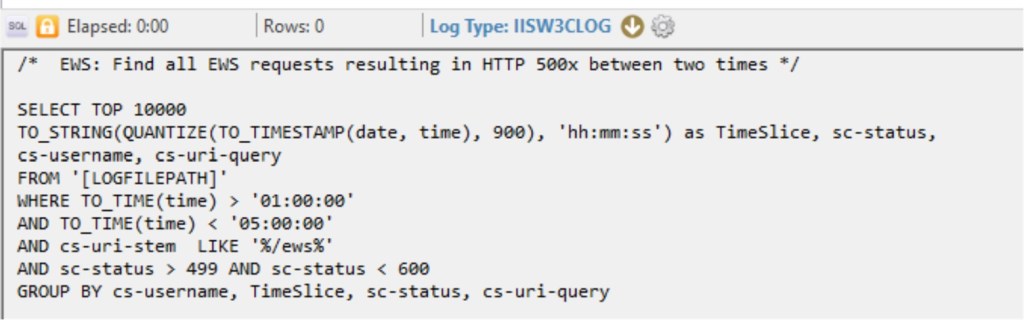
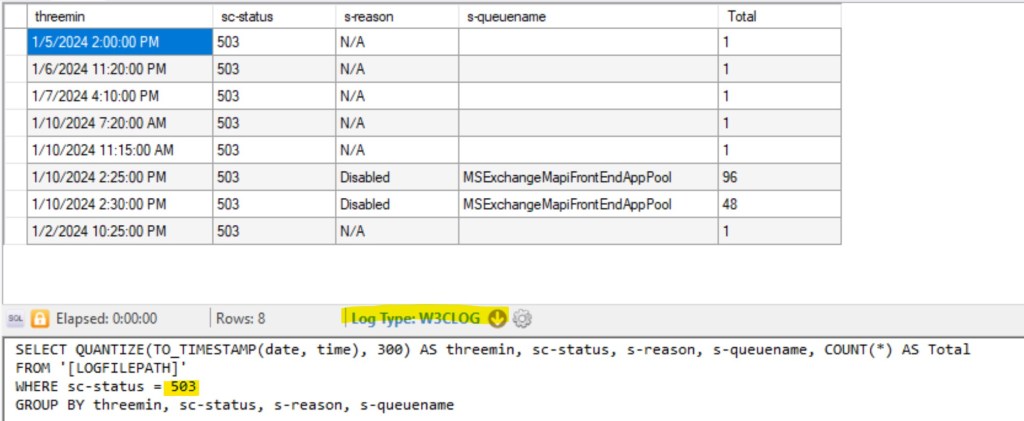
Also, a lot of reports are available for Exchange-specific protocols. This example is more complicated. You can see how QUANTIZE function is used to group request for specific time range (15 minutes interval)
Troubleshooting complex issues sometimes requires you to be creative. This is not that we have pre-defined and pre-created queries for each case you can experience.
As example, I can recall a situation with High CPU usage. Via Task Manager we could identify that this load is cause by MSExchangeMapiFrontEndAppPool. That means, that first thing that we can potentially investigate – IIS Default Web Site logs on problematic server. Of cause, we’re interested who creates this load. And first thing I’ve tried – to understand, how many requests are issued per-hour, for example. How many requests do we have when problem doesn’t exists and how many when it occurred? If you see difference (I did) you can dig into specific period of time to get more information and try to find something common between requests. Requests can come from specific IP address, user or User-Agent. The last was our case.
In the end, I finished with requests like that to calculate requests per-minute and group them by User-Agent. Data is filtered for problematic period and mapi requests only (W3VC1 folder).
SELECT QUANTIZE(TO_TIMESTAMP(date, time), 60) AS min,
COUNT(*) AS Total,
TO_LOWERCASE(cs-uri-stem) AS Vdir, cs(User-Agent)
FROM ‘[LOGFILEPATH]’
WHERE cs-uri-stem LIKE ‘/mapi%’ AND to_timestamp(date,time) between timestamp(‘2018/10/19 07:00′,’yyyy/MM/dd hh:mm’ ) and timestamp(‘2018/10/19 08:20′,’yyyy/MM/dd hh:mm’ )
GROUP BY min, Vdir, cs(User-Agent)
ORDER BY min
This is an example for 1 minute range, and most of the requests are coming from UcMapi.exe, related to Lync. So, it’s not even Outlook client that creates an issue.

According to information provided by Lync engineer, if Lync client is not able to access Exchange Server via EWS protocol, it will switch to Mapi. So, the next step would be to investigate this issue from Lync perspective.
To filter your logs for specific time range you can use a little bit more simple construction:
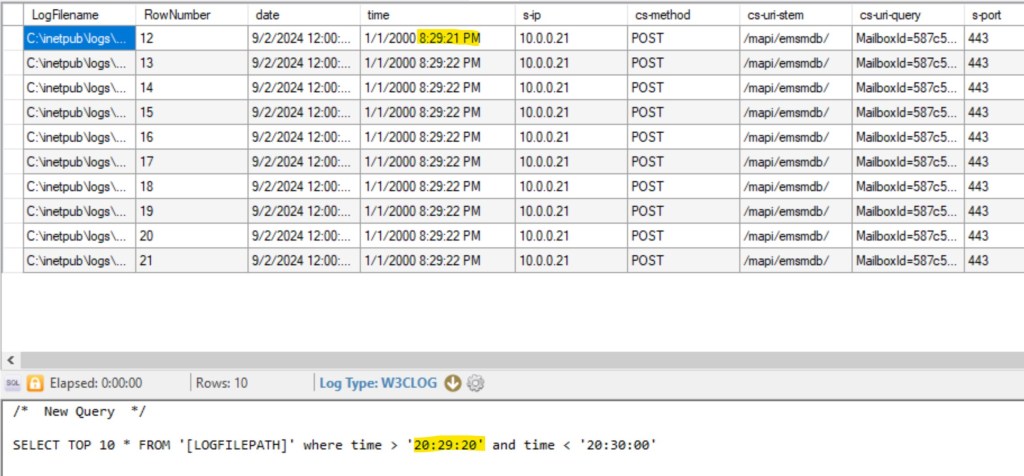
In this example, 8:28:21 pm is represented as 20:29:21. Also, don’t forget that this time is actually in UTC.
Note. Default queries for IIS logs are pre-configured with IISW3CLOG log type. That will not work if you added custom fields. You can use W3CLOG type instead.
🛠️Httperr IIS logs and LPS
Some errors that occur in an HTTP-based application are automatically handled by the HTTP API instead of being passed back to an application for handling. This behavior occurs because the frequency of such errors might otherwise flood an event log or an application handler.
Httperr logs are located in C:\Windows\System32\LogFiles\HTTPERR, they are not rotated. But they are really small in size, although for a couple of years they can consume 2-3 GB.
Below you can see, that MSExchangeMapiFrontEndAppPool is disabled. You won’t see any records for those connections is IIS logs files.
#Software: Microsoft HTTP API 2.0
#Version: 1.0
#Date: 2024-01-09 03:52:52
#Fields: date time c-ip c-port s-ip s-port cs-version cs-method cs-uri streamid sc-status s-siteid s-reason s-queuename
2024-01-10 14:27:49 212.45.3.130 52650 172.16.250.66 443 HTTP/1.1 POST /mapi/nspi/?MailboxId=356c0b0e-bca0-4aa5-90ae-615f9fea1237@kite2u.com – 503 1 Disabled MSExchangeMapiFrontEndAppPool
LPS has some pre-defined requests for httperr logs:
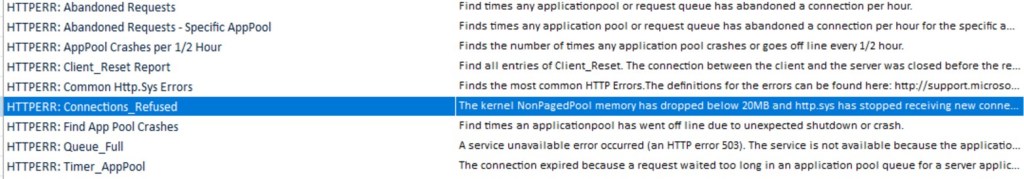
You can modify existing queries or create a new one.
💡Note. Default queries for HTTPerr logs are pre-configured with HTTPERRLOGFILE log type. That doesn’t work for me with latest versions of Windows. I use W3CLOG instead.
For more information about Httperr logs: Error logging in HTTP APIs
🛠️Working with Exchange HTTP protocol logs
Exchange Server has additional logs that can be useful to troubleshooting client connections. Log paths are pretty the same.
For example, connections for mapi\http clients connected to Default Front End (first endpoint client connects via load blancing) are logged in C:\Program Files\Microsoft\Exchange Server\V15\Logging\HttpProxy\Mapi.
Then, the client proxied to Backend server, where his mailbox is located, and connections are logged in C:\Program Files\Microsoft\Exchange Server\V15\Logging\MapiHttp\Mailbox. It’s almost the same for other protocols. Some of them, like OWA / ActiveSync don’t have backend logs.
LPS doesn’t have any prepared queries for such kind of logs. HTTP protocol logs contain much more Exchange specific information like latencies on different levels (AD, proxy and etc.), detailed exceptions if they occur. And also, we can correlate specific connections from IIS logs with HttpRroxy logs, for example.
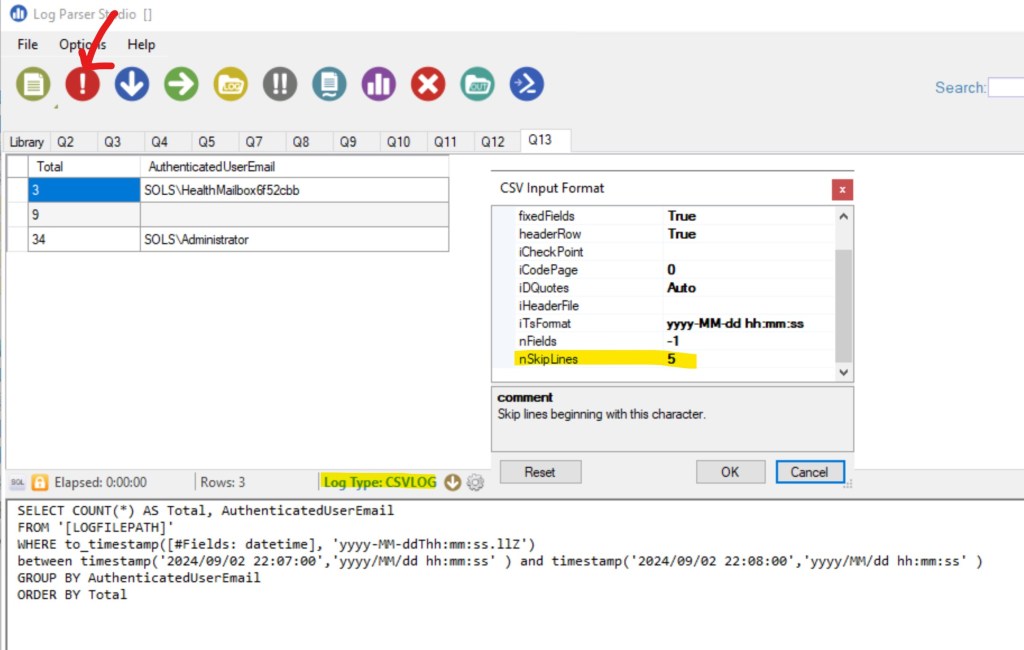
A simple example of query allows to get statistics for user’s connections for specific period (note, that this is done differently for IIS and Exchange protocol logs). It is presented in one field called DateTime. Example: 2024-01-22T22:00:01.913Z
Note, how we reference datetime field, as in started from #Fields: prefix.
SELECT COUNT(*) AS Total, AuthenticatedUserEmail
FROM ‘[LOGFILEPATH]’
WHERE to_timestamp([#Fields: datetime], ‘yyyy-MM-ddThh:mm:ss.llZ’) between timestamp(‘2024/09/02 22:07:00′,’yyyy/MM/dd hh:mm:ss’ ) and timestamp(‘2024/09/02 22:08:00′,’yyyy/MM/dd hh:mm:ss’ )
GROUP BY AuthenticatedUserEmail
ORDER BY Total
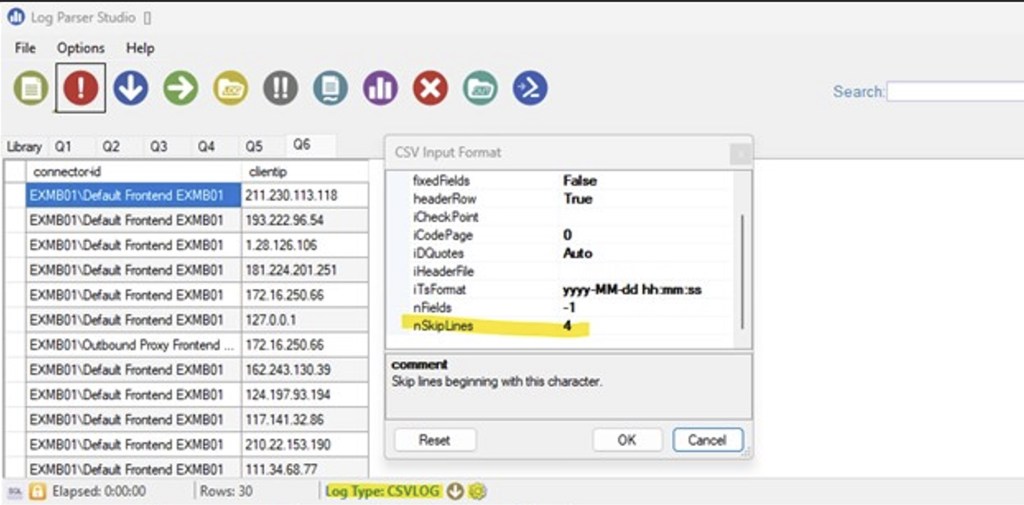
Another thing, because fields definition starts only from 6th line, and we use csv format:

We need to skip first 5 rows:
Assume, we would like to get information about client versions, connected via mapi / http. For that, we can use C:\Program Files\Microsoft\Exchange Server\V15\Logging\MapiHttp\Mailbox
SELECT ClientSoftware, ClientSoftwareVersion
FROM ‘[LOGFILEPATH]’
Group by ClientSoftware,ClientSoftwareVersion

🛠️IIS and HTTP protocol logs correlation
Sometimes, we have a request from Fiddler trace that we want to trace in Exchange Server logs. In Fiddler you will find information below vailable:
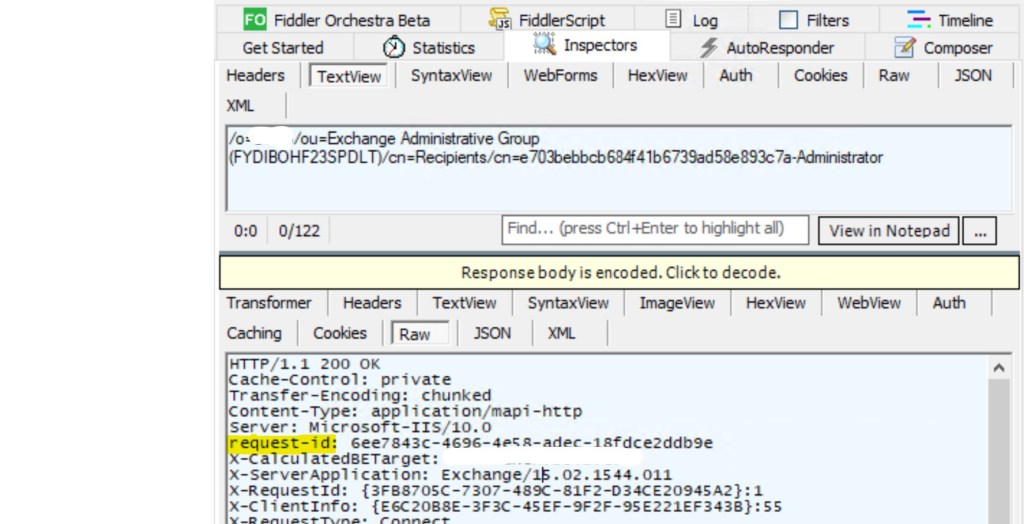
In this case, you can use query below to trace this request in IIS Front End log (W3SVC1):
SELECT *
FROM ‘[LOGFILEPATH]’
WHERE cs-uri-query like ‘%6ee7843c-4696-4e58-adec-18fdce2ddb%’
Let’s look at the cs-uri-query value:
MailboxId=00aaf345-7e6e-4f37-89a0-f65f04e64616@sols.com&CorrelationID=;&ClientRequestInfo=R:{3FB8705C-7307-489C-81F2-D34CE20945A2}:1;RT:Connect;CI:{E6C20B8E-3F3C-45EF-9F2F-95E221EF343B}:55;CID:{85E161CF-FACC-4CF4-8559-71562C3793E4}&cafeReqId=6ee7843c-4696-4e58-adec-18fdce2ddb9e;
So, we can also correlate other values from fiddler trace (assuming we don’t wont to look for specific request, but for a set of requests or specific client). Here we look for specific request, so it’s listed as cafeReqId value.
The next step, proxying to IIS Backend site, so we need to check mapi\http httproxy logs first.
CafeReqID in cs-uri-query field in IIS Front End logs correlates with RequestID field in HttpProxy logs – 6ee7843c-4696-4e58-adec-18fdce2ddb9e
You can use request below to search for appropriate request:
SELECT *
FROM ‘[LOGFILEPATH]’
WHERE requestid = ‘6ee7843c-4696-4e58-adec-18fdce2ddb9e’
Also, ClientRequestInfo in cs-uri-query field in IIS Front End logs correlates with ClientRequestId field in HttpProxy logs. So, we have different options to correlate logs between each other depending on the specific issue.
Next, steps – IIS backend logs. This can be different for different protocols. For example, you can find that in cs-uri-query field in IIS Backend End logs you will have the same values of CafeReqID and ClientRequestInfo. But for MAPI \ HTTP you will probably notice that there’s not correlation at all. In this situation, you can search for specific requests for specific mailbox at exact time frame.
SELECT * FROM ‘[LOGFILEPATH]’
where cs-username LIKE ‘%administrator%’ and cs-uri-stem like ‘%emsmdb%’
and to_timestamp(date,time) between timestamp(‘2024/09/02 22:21:00′,’yyyy/MM/dd hh:mm:ss’ ) and timestamp(‘2024/09/02 22:21:20′,’yyyy/MM/dd hh:mm:ss’ )
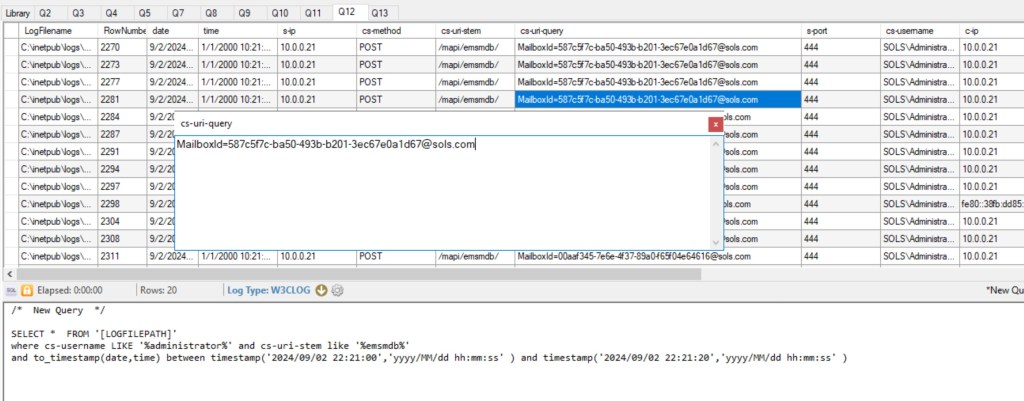
In mapi backend logs RequestId will contain the same value we used before (also you can see correlation with another fields).
SELECT *
FROM ‘[LOGFILEPATH]’
WHERE requestid = ‘6ee7843c-4696-4e58-adec-18fdce2ddb9e’
It’s rare when you need to follow though all the chain of requests, but it’s useful to understand how to correlate logs between each other.
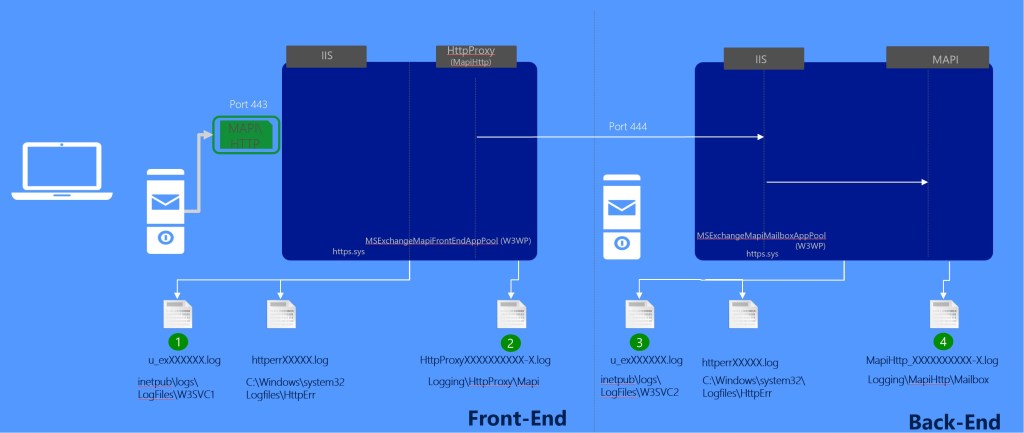
This picture summarizes mapi\http connection flow and corresponding logs:
🛠️Working with Exchange SMTP protocol logs
Some clients can have issues on SMTP level while sending email. That means, you won’t see any entries for these issues in Message Tracking logs. While sending via smtp, clients do that through receive connector ion Exchange Server. Or, for example, Exchange Server can try to send something to external system through send connector.
Some integrated connectors have protocol logging enabled by default. For new ones, you need to enable it manually:
Set-ReceiveConnector / Set-SendConnector –ProtocolLoggingLevel Verbose
Path for smtp logs can be verified via Get-TransportService or Get-FrontEndTransportService | fl *ProtocolLogPath*
Smtp protocol log example looks similar. Same format of date-time, although written slightly differently.
Fields definition starts from 5th line and we also use csv format:
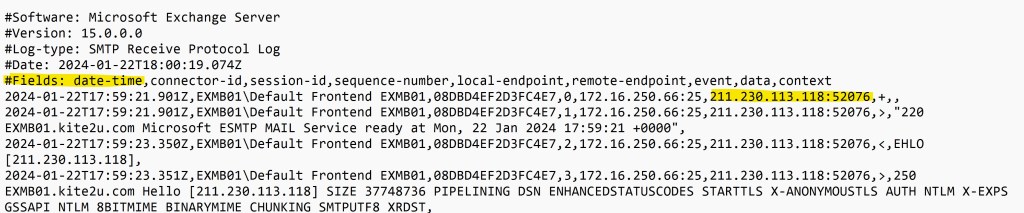
Note, that local and remote endpoints contain IP and port in one line. So, for example, if you would like to get list of IP addresses that are sending something via specific connector for specific range of time, it will look like this:
SELECT connector-id, EXTRACT_PREFIX([remote-endpoint],0,’:’) as clientip
FROM ‘[LOGFILEPATH]’
WHERE to_timestamp([#Fields: date-time], ‘yyyy-MM-ddThh:mm:ss.llZ’)
between timestamp(‘2024/09/01 01:07:00′,’yyyy/MM/dd hh:mm:ss’ ) and timestamp(‘2024/09/02 22:08:00′,’yyyy/MM/dd hh:mm:ss’ )
group by connector-id, clientip
In smtp protocol logs each smtp session has it’s own session id. So, you can trace problematic session:
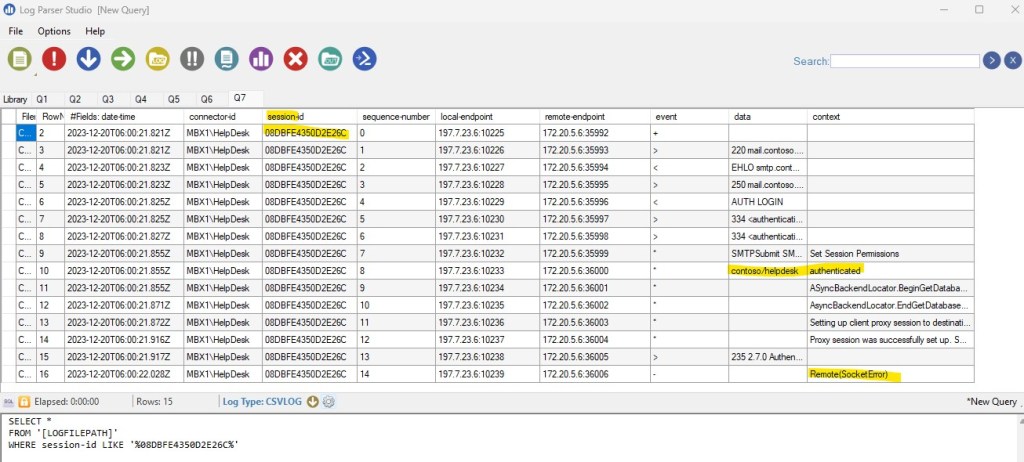
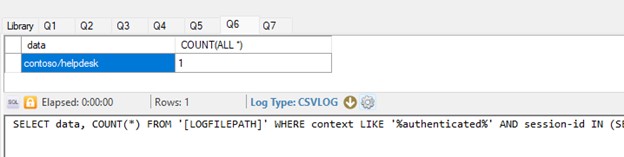
But assume, you would like to trace all authenticated sessions that ended with Remote(Socket Error) error. LDP (logparser) doesn’t implement full power of SQL. But still, you can have some analog of join for that specific request:
SELECT data, COUNT(*) FROM ‘[LOGFILEPATH]’ WHERE context LIKE ‘%authenticated%’ AND session-id IN (SELECT session-id FROM ‘[LOGFILEPATH]’ WHERE context LIKE ‘%Remote(SocketError)%’) GROUP BY data
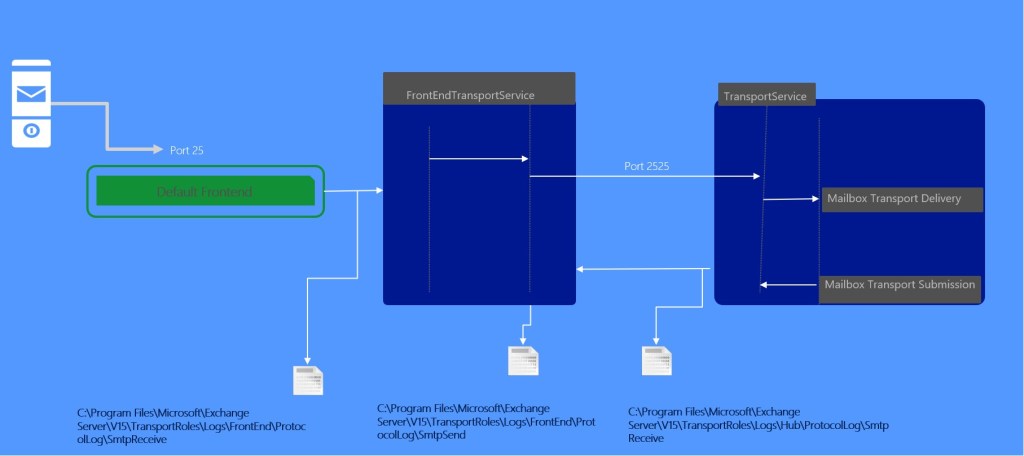
This picture provides example of smtp protocol flow. Note, that flow depends for each scenario. Connectors, ports and etc. may vary.
🛠️Working with Exchange Message Tracking logs
For simple, usual tasks it should be enough to use cmdlets like Get-MessageTrackingLog cmdlet to troubleshoot message delivery issues.
But in some cases, it’s easier and more reliable to analyze MT logs with LogParser directly. While working on cases it’s also easier and less time consuming to ask your customer to provide you corresponding logs and analyze them if you have time.
By default, MT logs are located in %ExchangeInstallPath%TransportRoles\Logs\MessageTracking folder. You can verify that with Get-TransportService cmdlet.
Naming convention is MSGTRKServiceyyyymmdd-nnnn.log. Where yyyymmdd is the coordinated universal time (UTC) date when the log file was created. yyyy = year, mm = month, and dd = day.
Logs are coming from several services. You need corresponding logs from all of them for consistent trace, but usually it’s not the case, as all logs are located in the same folder.
LPS has some predefined queries for MT logs. Although they were designed for Exchange 2010 (yes, LPS is an old one), they still can be customized for later versions.
Assume, we want to track message with specific subject for specific time-range:
SELECT [#Fields: date-time], message-subject, source, event-id, source-context
FROM ‘[LOGFILEPATH]’
WHERE message-subject LIKE ‘%track%’ and to_timestamp([#Fields: date-time], ‘yyyy-MM-ddThh:mm:ss.llZ’)
between timestamp(‘2024/09/01 01:07:00′,’yyyy/MM/dd hh:mm:ss’ ) and timestamp(‘2024/09/04 22:08:00′,’yyyy/MM/dd hh:mm:ss’ )
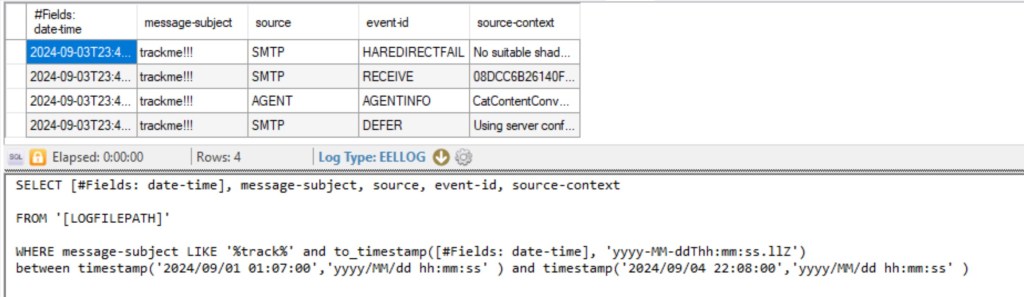
From that output we can see that message was deferred (STOREDRIVER – DELIVER). Also, you can see that there’re some issues with shadow redundancy (HARDREDIRECTFAIL). Of cause, you need to know what kind of events and source exists, in which order events can reoccur. Also, the result depends on parameters, used for filtering. But this is not something we can cover in this post.
⚠️Best practices for optimizing queries in LogParser
From my experience I would like to share some best practices for optimizing queries in LogParser. This is important if you work with a large amount of data.
- Filtering at the source level: Always try to limit the amount of data processed by using the WHERE clause. This helps reduce the number of rows that need to be read and processed, significantly speeding up the query execution.
- Select Only Necessary Columns: Minimizing data volume, avoid using SELECT *. Instead, choose only the columns you actually need. This reduces the amount of data that needs to be transferred and processed.
- Use Aggregation Functions (GROUP BY) Wisely: Reducing the amount of data processed: If you need to aggregate data, try to limit the data set before grouping by using
WHERE. - Optimize the Order of Clauses: Simplifying expressions: Place the most selective filters at the beginning of conditions. For example, if one part of the condition greatly limits the number of rows, it should be placed first in the
WHEREclause. - Use Correct Data Types: Ensure that you use the correct data types when filtering. For example, if filtering by date, use the
TO_TIMESTAMP()function to convert a string to a date.
In any case, during analysis, it’s important to minimize the volume of data. If it’s not a matter of statistical tasks and the goal is to solve a specific problem, then localizing the issue to the time period in which it occurred allows you to use only the logs that contain information for the necessary period.
🧰Log Parser Studio – Useful blogs and articles
Don’t forget to review these great posts and articles about LogParser studio! 😊
🔗Introducing: Log Parser Studio
🔗Log Parser Studio 2.0 is now available
🔗Log Parser Timestamp Format Specifiers
End.

Leave a comment